Intel has more than tripled in 2026 — so was Friday’s 3.45% drop the first crack, or just a breather? The data behind the move tells a calmer story than the headlines.
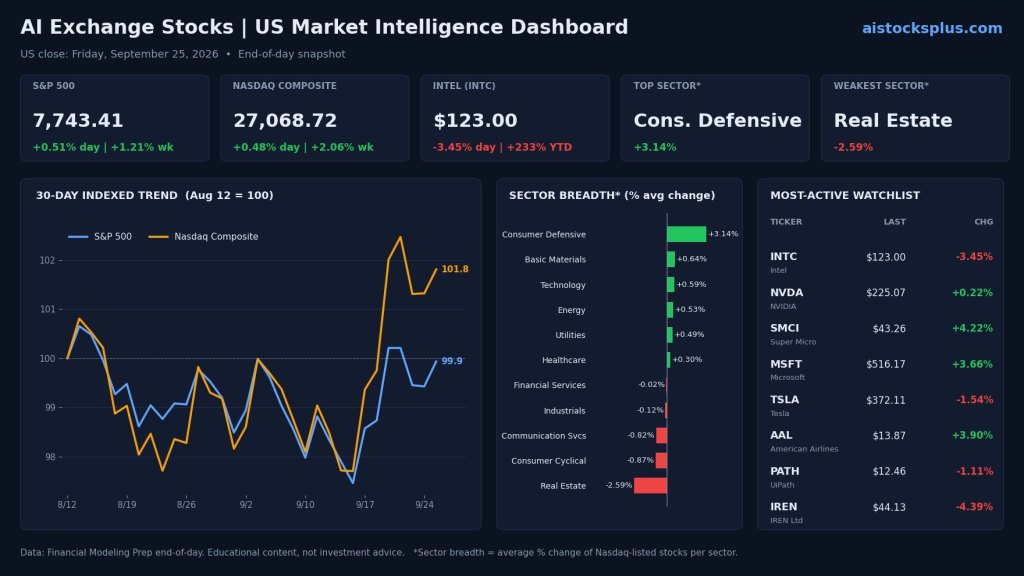
Intel (INTC) closed Friday at $123.00, down 3.45%, as traders locked in gains after one of the strongest runs in the S&P 500 this year. Even after the dip, the stock is up about 233% from its 2025 closing price of $36.90 and roughly 37% in September alone. Meanwhile, the broader market finished the week higher, led by AI-heavy tech. Here’s the dashboard, and what an AI stock analysis platform would have made of it.
The 60-second market dashboard
- S&P 500: 7,743.41, up 0.51% on Friday and 1.21% for the week.
- Nasdaq Composite: 27,068.72, up 0.48% on Friday and 2.06% for the week.
- Intel: $123.00 (−3.45%), still up about 13% for the week, 37% for September and 233% year to date — but about 13% below its June 22 closing high of $140.94.
- Chip peers: Super Micro Computer +4.22% and NVIDIA +0.22%, so the selling was Intel-specific rather than sector-wide.
- Sector breadth (Nasdaq-listed averages): Consumer Defensive led at +3.14% and Technology rose 0.59%; Real Estate was weakest at −2.59% with the 10-year Treasury yield near 5.2%.
- Other most-active names: Microsoft +3.66%, Tesla −1.54%, American Airlines +3.90%.
What an AI stock analysis platform would have flagged
1. Volume anomaly — or the lack of one. Friday’s decline came on about 97.7 million shares, roughly 8% below Intel’s average over the prior 19 sessions. Compare that with September 21, when the stock rose more than 12% on about 192 million shares, nearly double normal. Real-time exchange analytics read this pattern as orderly profit-taking, not a rush for the exits: buyers showed up in force on the way up, and sellers did not show up in force on the way down.
2. Stock market sentiment analysis. The tone of coverage shifted during the week. Early headlines tied Intel’s jump to the AI-agent theme, after Meta launched an agent that completes tasks for users and investors bet on more data-center CPU demand. By Friday, headlines were focused on valuation and profit-taking. A sentiment model would log that as cooling enthusiasm rather than a clear turn negative.
3. Predictive financial modeling. Valuation is the key input now. Recent coverage puts Intel at roughly 84 times this year’s earnings estimates and about 62 times next year’s, well above NVIDIA’s high-20s multiple. Reports also point to supply constraints on CPUs and negative GAAP profit margins. Predictive models that weigh growth expectations against price would flag how much future execution is already built into the stock.
4. Automated investment research. Automated research tools stitch together the full timeline in seconds: an 18A-P manufacturing node entering risk production in June, reported foundry interest from large customers, a volatile summer that took the stock from about $140 down to the low $80s, and a September rebound of more than 30%. That context turns a single red day into one point on a much bigger chart.
From signals to strategy: algorithmic trading tools and AI portfolio optimization
A stock that triples in nine months can quietly take over a portfolio. AI portfolio optimization watches for exactly that kind of drift, flagging when one winning position grows past its target weight. Algorithmic trading tools can then turn rules such as “alert me if volume on a down day exceeds 1.5 times average” into automatic signals, so decisions aren’t driven by one headline. This is where machine learning finance and smart wealth management meet: rules, risk limits and rebalancing, applied consistently. AIStocksPlus brings those ideas together as FinTech investing software, combining sentiment, volume and trend data in one AI dashboard.
Key takeaways for this week
- Intel’s volume on down days: If selling picks up on heavy volume, profit-taking could turn into a deeper reset; light volume would suggest the trend is intact.
- Trade headlines: The US and China are releasing the product lists for their new tariff-cut deal, which could move chip and hardware names.
- AI developer events: OpenAI’s Developer Day on Tuesday, September 29 may keep the AI-agent theme in focus.
- Rates and macro data: The 10-year yield near 5.2%, the PCE inflation report and the September jobs report can all shift appetite for high-multiple tech.
- Intel’s October earnings: Gross margins and foundry progress will be tested against a valuation that now expects a lot.
#AIStocks #AIInvesting #StockMarket #FinTech #MachineLearning #AlgoTrading #PredictiveAnalytics #SentimentAnalysis #WealthManagement #StockMarketToday #INTC #Intel #Semiconductors #NVDA #SMCI
Sources: Financial Modeling Prep end-of-day index, sector, most-active and INTC price/volume data (percentages calculated from FMP closing prices); market coverage from The Motley Fool, TradingKey, TIKR and CNN Business. This article is for educational and informational purposes only and is not investment advice. Always do your own research or consult a licensed financial advisor before making investment decisions.


Leave a comment